
Want to learn more about ClioVis and its impact in the classroom and the broader edtech sector? This section provides updates on company developments, conference presentations, workshops, and reviews of the software from educators, researchers, and academic publications.
Our monthly newsletter brings together the latest on digital innovation in the humanities and STEM, highlighting new ClioVis projects, conference appearances, podcasts, and multimedia content. Tap the newsletter title to read each full bulletin, and don’t forget to subscribe via our Contact Us form to receive updates directly.
This section summarizes independent reviews, interviews, and instructor assessments of ClioVis, showcasing its classroom applications and measurable impact on student learning. These reviews highlight improvements in critical thinking, research organization, and visual reasoning when students use ClioVis for assignments and collaborative projects. Read below to explore what scholars and educators are saying about ClioVis.
By Lindsey Passenger Wieck — Winter 2025
Published in Teaching History (Vol. 50, No. 1), historian Dr. Lindsey Passenger Wieck of St. Mary’s University offers a detailed review of ClioVis, describing it as an “incredible addition to the classroom” that enhances student engagement, collaboration, and historical thinking. Developed by Dr. Erika Bsumek at the University of Texas at Austin with developers Matt O’Hair, Ian Diaz, and Braeden Kennedy, ClioVis allows students to build digital timelines, mind maps, and presentations collaboratively.
Wieck highlights how ClioVis helps students move beyond rote memorization to synthesize historical themes, analyze sources, and develop arguments. She praises the tool’s connections feature, which lets students visualize relationships between events—turning timelines into opportunities for deeper analytical thinking. The simplified view is also commended for improving accessibility and grading ease, supporting screen readers and keyboard navigation.
In her own classes, Wieck uses ClioVis weekly for group projects on 20th-century U.S. history, where students identify key events, contextualize primary sources, and collectively write thesis statements for each timeline. She notes that this approach empowers students to act as “experts” in their themes and fosters meaningful discussions about continuity, change, and interpretation.
Wieck also highlights ClioVis’s versatility: students can export projects as URLs for submission in Canvas or Blackboard, present timelines in presentation mode, or embed them on websites for public-facing projects. She praises the support and tutorial resources provided by the ClioVis team, as well as the tool’s intuitive design and flexible pricing options that make it accessible across institutions.
Ultimately, Wieck concludes that ClioVis offers a low-barrier, high-impact platform for teaching historical analysis, noting that students consistently list it among their favorite classroom tools because it allows them to “explore topics of interest and engage with content more deeply.”
By Jason A. Heppler — March 2024
Published in the Journal of American History, historian Jason A. Heppler (George Mason University) praises ClioVis as “a tremendously useful tool” that gives educators and students an interactive, visual way to explore historical events and their relationships. Developed at the University of Texas at Austin by Dr. Erika Bsumek with developers Ian Diaz and Braeden Kennedy, ClioVis enables users to build timelines linking events through color-coded nodes and labeled connections—essentially turning chronology into a mind map of cause and effect.
The review highlights the platform’s strong pedagogical design and flexible features, including multimedia embedding, collaborative chat, genealogy import, and presentation mode. Heppler notes that the tool supports educators with clear tutorial videos and affordable pricing tiers, especially for academic users.
While suggesting small improvements in interface polish and technical documentation, Heppler concludes that ClioVis excels as a research and teaching aid, helping users organize ideas, visualize complexity, and present historical material in dynamic, interconnected ways.
University of Texas at Austin — October 2024
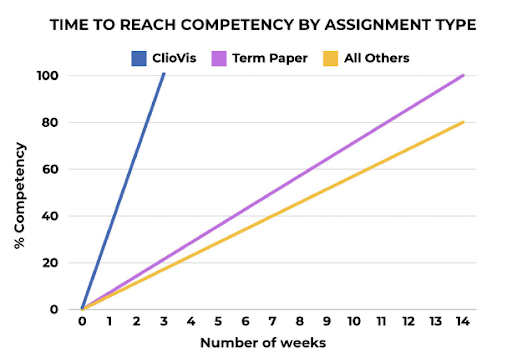
According to an internal Core Curriculum Assessment conducted by the UT Austin Department of History, building a ClioVis timeline is as effective as writing a term paper in developing key learning competencies outlined in the university’s core curriculum. The report also found that students achieved these outcomes in less than one quarter of the time typically required to complete a traditional paper—demonstrating ClioVis’s efficiency as both a teaching and assessment tool.
By Maia Borchardt — November 3, 2023
This feature explores how ClioVis reshapes the way students visualize and interpret history. Developed by Dr. Erika Bsumek, the platform teaches students to move beyond linear timelines by mapping causes, correlations, and conceptual connections between events, people, and ideas.
Used in 27 universities and across disciplines—including biology, nursing, and engineering—ClioVis enables users to add multimedia, color-coded categories, and thesis statements to support original analysis. The article also highlights accessibility improvements, new visual designs, and ongoing updates based on user feedback.
June 24, 2021
As part of its Critical Literacies Project, the University of Texas System recognized ClioVis as a model for improving both historical and digital literacy. The feature highlights how ClioVis helps students organize research, identify conceptual relationships, and present findings to wider audiences across disciplines—from history to biology and the sciences.
Supported by the UT System, ClioVis is presented as a cutting-edge educational technology that enables students to connect classroom learning with real-world applications.
By Lindsey Passenger Wieck — February 9, 2020
In this Pedagogy Playground review, historian Dr. Lindsey Passenger Wieck highlights ClioVis as an exceptional tool that fosters critical thinking, collaboration, and interactivity in the classroom. ClioVis enables students to build digital timelines that not only plot events but also explain the connections between them—encouraging deep analysis of historical relationships.
Wieck praises the software’s ease of use, real-time collaboration, and exportable features, making it ideal for undergraduate and even high-school courses. She concludes that ClioVis is “an incredible tool” and “a labor of love,” combining thoughtful pedagogy with practical functionality.
By Alex Reshanov — August 7, 2019
This Life & Letters feature profiles Dr. Erika Bsumek, Associate Professor of History at UT Austin, and the creation of ClioVis, a digital tool designed to help students move beyond memorizing dates to understanding how events connect within broader narratives.
Developed in collaboration with UT’s Simulation and Game Applications (SAGA) Lab and supported by a Provost’s Teaching Fellowship, ClioVis allows users to build dynamic timelines where each “node” represents an event, idea, or person—complete with evidence and visual links showing relationships and significance.
The article showcases how students and instructors use ClioVis to make learning interactive, collaborative, and analytical, from mapping urban development to exploring how bicycles shaped the women’s suffrage movement.

Real stories. Real results — see ClioVis in action.
Join thousands of students, educators, and researchers who are transforming how they work with ClioVis.

Copyright, © 2025, ClioVis, Inc. Trademark Registration 8132633.