ClioVis helps users move beyond collecting information to actively making sense of it. Through its visual timeline grid, events, categories, eras, and connections, ClioVis gives students, instructors, and researchers a flexible space to organize evidence, identify relationships, and build coherent arguments.
Visualize the Thinking Process
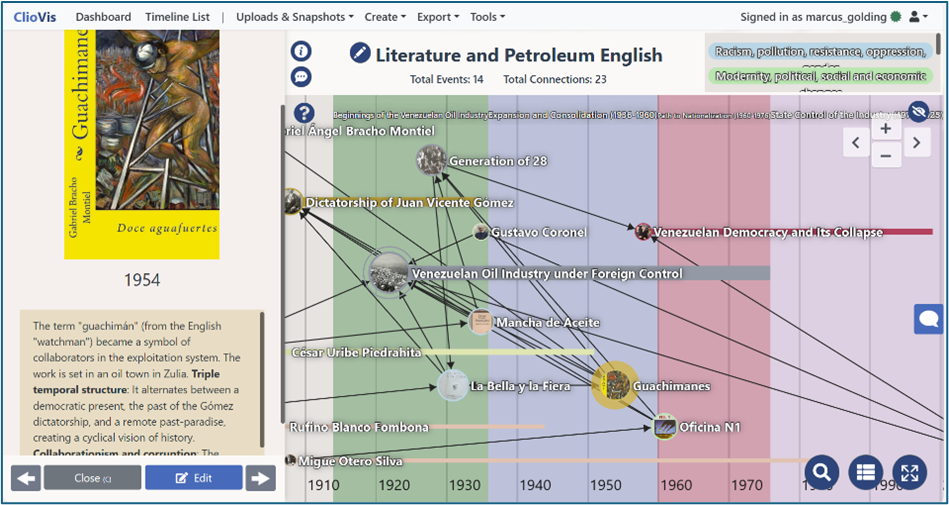
ClioVis is designed to make reasoning visible. Users can place information on a timeline, group it by category, organize it by era, and connect related events, ideas, people, places, or processes.
This allows users to see how different pieces of information relate to one another. Instead of treating research as a disconnected list of facts, ClioVis helps users transform scattered material into a structured visual argument.
Build Timelines and Conceptual Maps
The ClioVis grid can be used as a traditional timeline, but it can also function as a conceptual map. Users can organize material chronologically, thematically, analytically, or according to the logic of their research question.
This flexibility makes ClioVis useful across many disciplines. A history course might use it to trace change over time, while a research project might use it to map relationships among texts, actors, institutions, concepts, or events.
Connect Evidence, Ideas, and Arguments
Connections are one of ClioVis’s most powerful tools. They allow users to show relationships between different parts of a project, including causation, influence, comparison, continuity, contradiction, and change over time.
By drawing connections, users are asked to explain how and why pieces of evidence matter together. This encourages users to interpret course content and research materials, helping students and researchers build more persuasive, evidence-based narratives.
Strengthen Critical Thinking
In a world where students are often asked to process large amounts of information quickly, ClioVis provides a structured way to help students or users slow down, organize ideas, make conscious decisions, and think critically.
Rather than simply delegating work to AI or producing a final answer without showing the process, ClioVis encourages users to show each step of their thought process. Students can connect the dots, test relationships, revise interpretations, and develop arguments visually.
Turn Complexity into Clarity
Research often begins as a sea of disconnected notes, sources, dates, names, and ideas. ClioVis helps users turn that complexity into clarity.
By combining visual organization with evidence-based connections, ClioVis allows users to create timelines, conceptual maps, and research narratives that are easier to understand, present, and refine.